
Statcounter Problems on chart
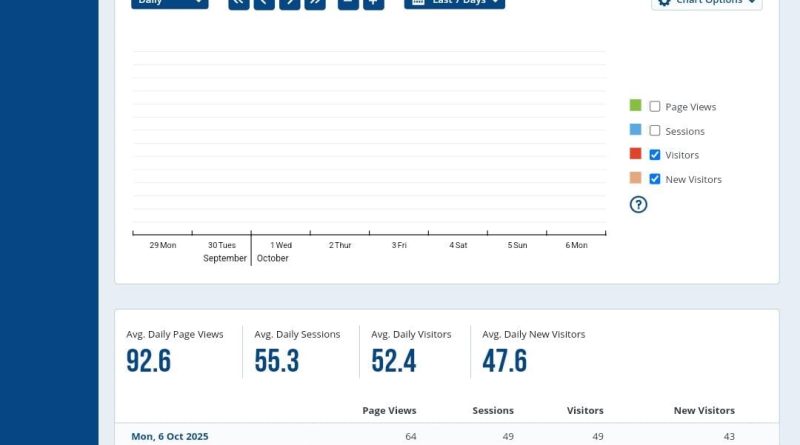
During the observation period from September 29 to October 6, 2025, an inconsistency was found in the Summary Stats section on Statcounter, particularly in the chart and daily statistics summary. Several journal administrators reported that the chart on the Statcounter page did not display any data (blank), even though the table below still showed significant visitor numbers.
Additionally, there are noticeable discrepancies between two different journals using the same tracking system and observation period. For example:
- JICL Journal shows the following daily averages:
- Page Views: 42.5
- Sessions: 18.0
- Visitors: 12.8
- New Visitors: 6.8
- Discourse Journal, within the same period, shows:
- Page Views: 92.6
- Sessions: 55.3
- Visitors: 52.4
- New Visitors: 47.6
Although the total figures still appear in the table, the trend chart remains blank, even though it previously displayed growth lines for Page Views, Sessions, Visitors, and New Visitors. This issue has caused confusion among journal administrators, as it prevents them from visually tracking daily traffic trends and comparing performance across days.
The possible causes of this issue may include:
- A system bug in Statcounter following an interface or display update.
- Temporary errors in chart rendering (JavaScript), causing data not to be displayed even though it exists.
- Incorrect date range settings, preventing the chart from reading the corresponding data.
- Account limitations (Basic/Trial version) that may automatically disable chart visualization after the trial period ends.